What pressure means on a dog collar
Pressure at a dog collar is force divided by area — two independent quantities. The formula: p = F / A, where p is mean surface pressure in N/cm² (1 N/cm² equals 10 kPa), F is leash force in Newton, and A is effective contact area in cm². Neither F nor A alone describes the pressure at the band.
Contact area A is not a fixed value. It depends on the geometry of the collar and the neck. When A increases at unchanged leash force, p̄ decreases. That is the core relationship this model is built on. What defines a wide dog collar is geometrically tied to that area.
This model describes mean surface pressure (p̄). It is not suited to predict local peak pressures, dynamic force spikes, or anatomical effects. No injury risk assessment follows from the model values. It describes a geometric relationship, not a clinical projection.
p = F / A
A ≈ b × R × θ
→ At constant F and θ, b determines area directly
→ Larger width → larger area → lower mean pressure in the model
How the contact area of a collar is formed
All comparative values in this article use a constant wrap arc of θ = 240° and a reference radius of R = 55 mm. The model assumes a time-constant leash force (Fstatic). Dynamic force spikes — a leash jerk, for example — are not covered.
The model simplifies the dog neck as a cylinder. R = 55 mm corresponds to a neck circumference of approximately 35 cm. The wrap arc θ describes the fraction of the neck circumference where the collar actually rests. With a standard buckle, θ is typically about 240°. Buckle, D-ring, and leash attachment interrupt contact over the remaining arc; 360° never occurs in practice. From these parameters, effective contact area is: A ≈ b × R × θ. At R = 55 mm and θ = 4.19 rad, the arc contact length is L ≈ 230 mm.
Diagram 2 shows how θ, R, and b interact as labelled dimensions and where the wrap arc separates the contact zone from the buckle and D-ring region.

The diagram makes the geometric core visible: not the full band length creates contact area, only the resting arc θ. When b increases at fixed θ, Aeff scales proportionally. That is the only degree of freedom in this model that is directly adjustable.
The table below shows how effective contact area and mean surface pressure change with collar width, at constant force and identical wrap arc.
| Collar width (mm) | Contact area Aeff (cm²) | Mean pressure p̄ at F = 40 N (N/cm²) |
|---|---|---|
| 20 | 46.1 | ~0.87 |
| 25 | 57.6 | ~0.69 |
| 30 | 69.1 | ~0.58 |
| 40 | 92.2 | ~0.43 |
The pattern is approximately linear: double width → double area → half model average.
Model values: Barklin contact geometry model v1.0, parameters: R = 55 mm, θ = 240°, F = 40 N
What 20, 25, 30, and 40 mm change at constant force
At constant leash force, collar width is the only directly controllable variable for mean surface pressure.
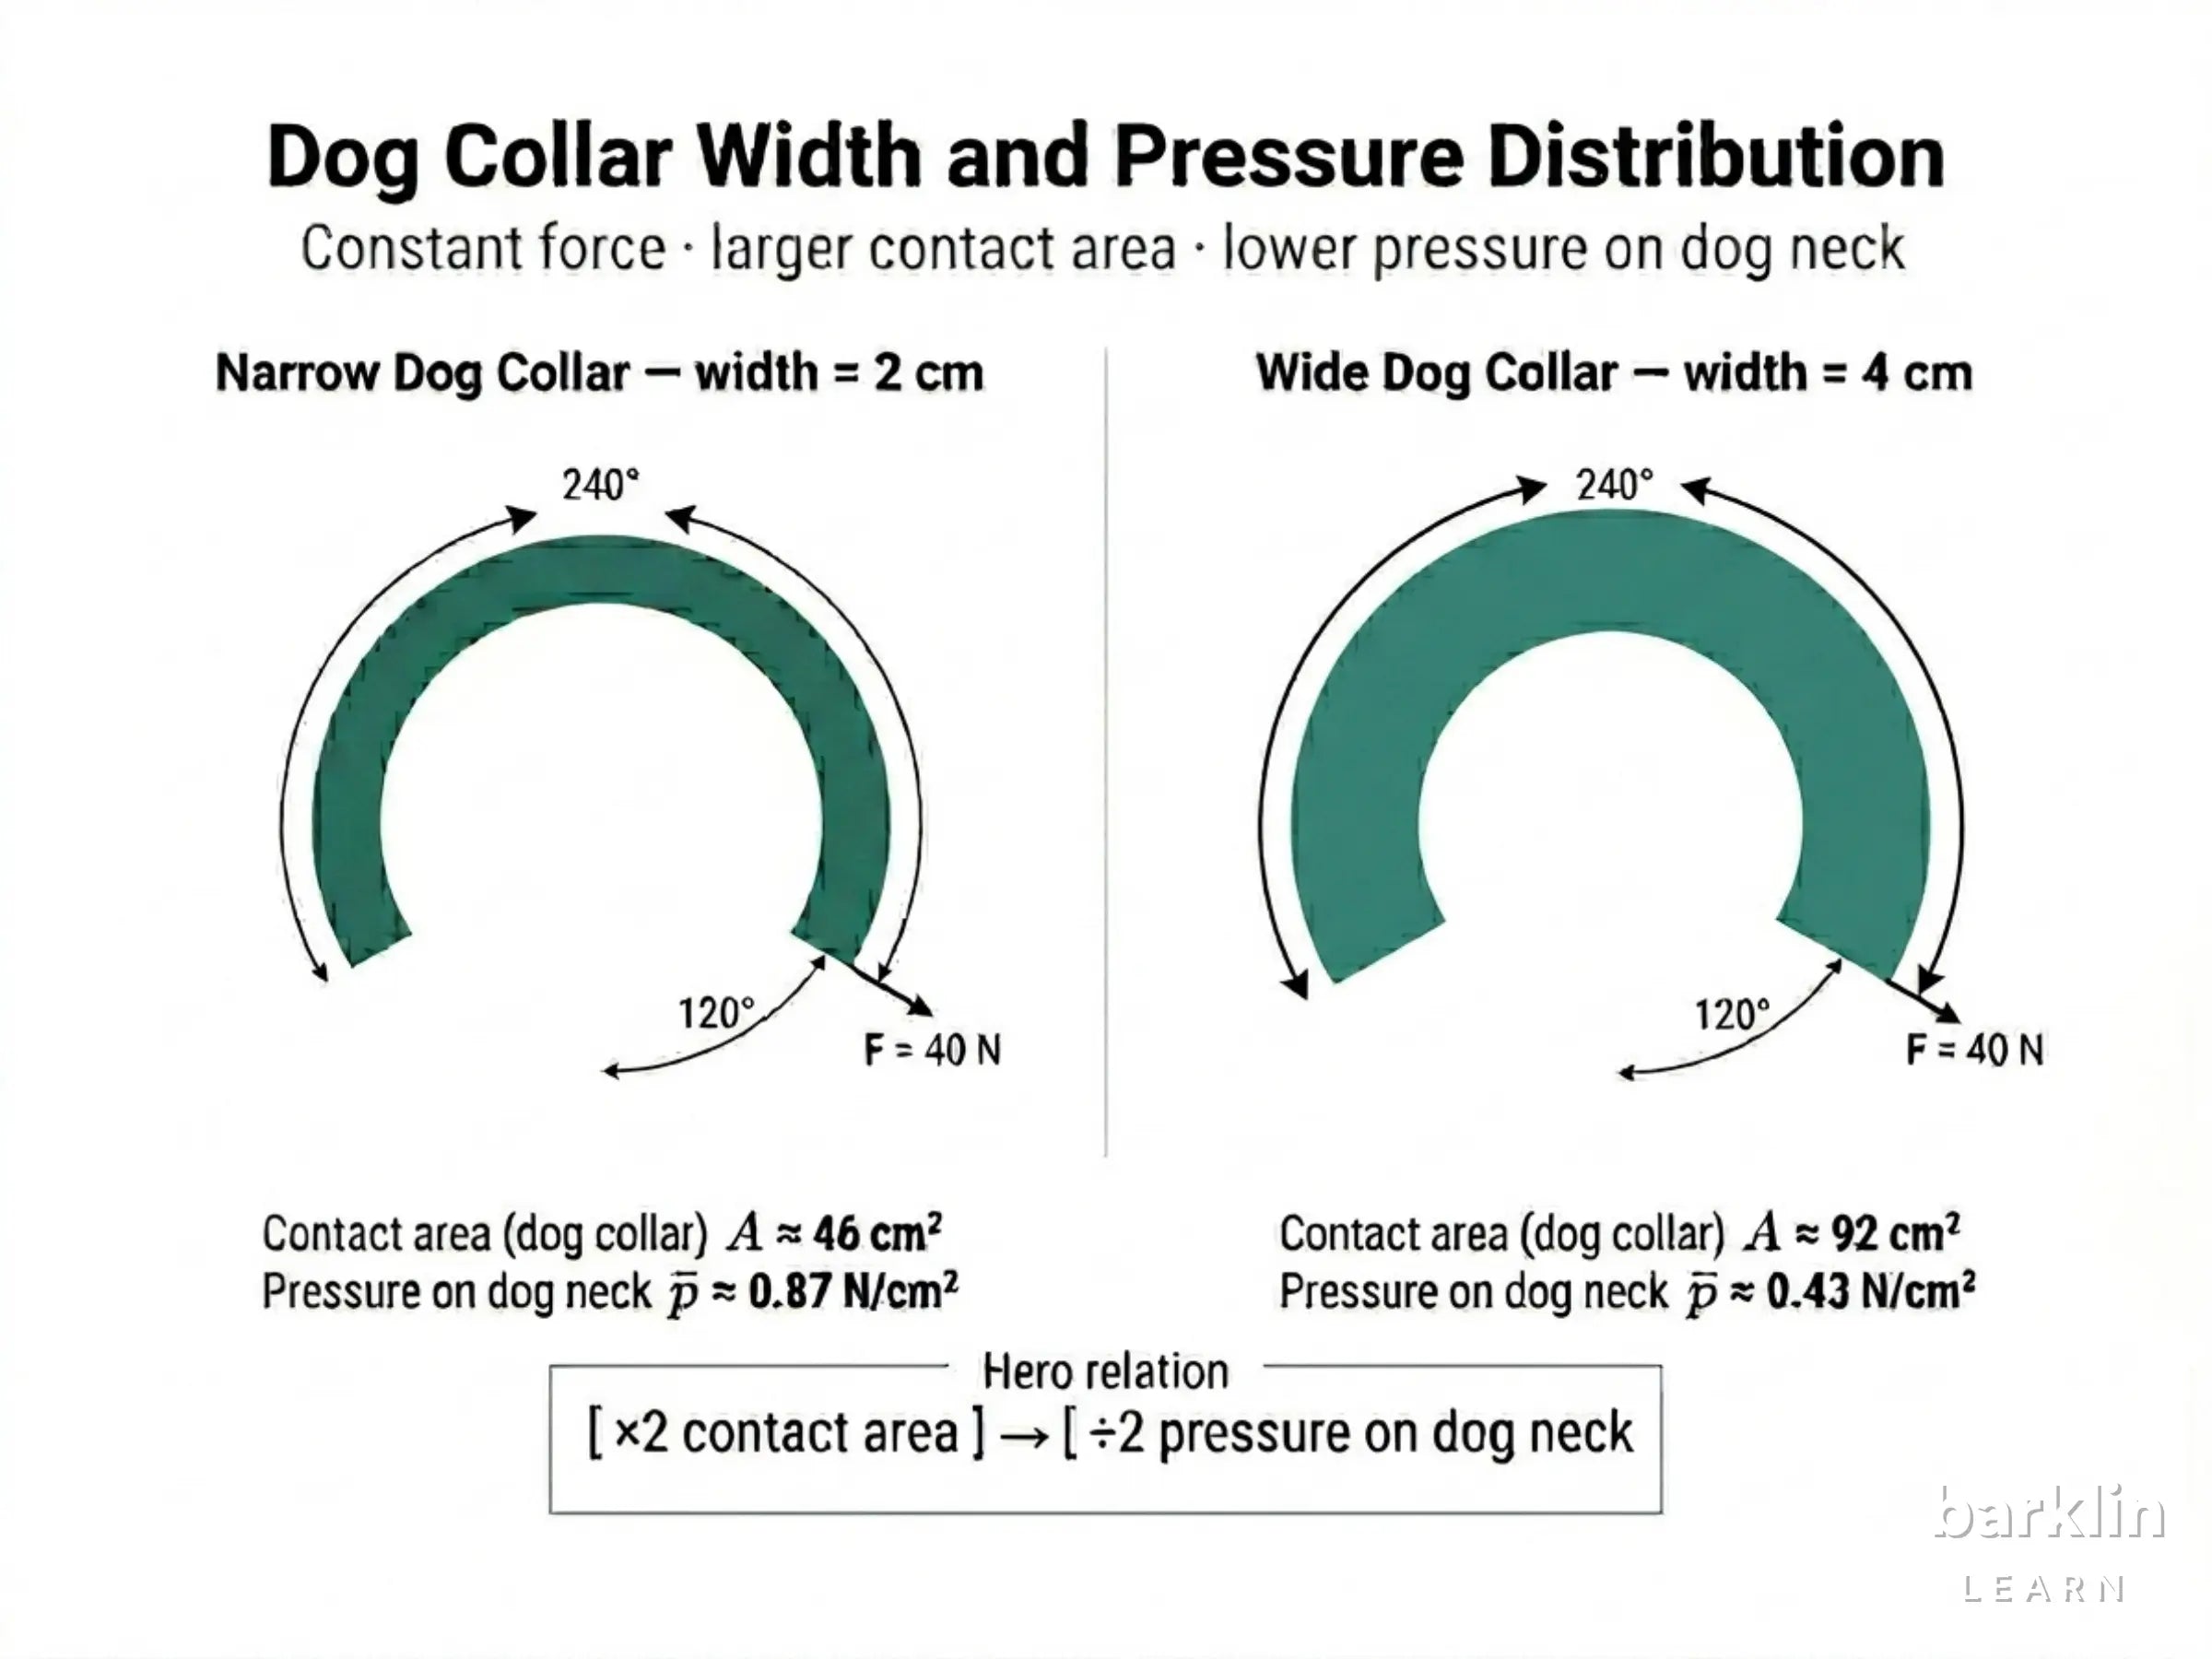
When width increases from 20 mm to 40 mm at constant F = 40 N, Aeff doubles from 46.1 cm² to 92.2 cm². Mean surface pressure in the model drops from ~0.87 N/cm² to ~0.43 N/cm². This follows directly from A ≈ b × R × θ: with R and θ fixed, A scales proportionally with b. The scaling relation holds under the assumption of full-surface contact and circular neck approximation.
That assumption fails more often than the model expects.
Diagram 3 shows the 20 mm and 40 mm model values as a side-by-side comparison: equal force, different widths, contact areas quantified.

The diagram presents the scaling relation as a geometric fact: in the model, double width at equal force gives approximately half the mean pressure value. Why that does not hold in practice is the subject of the next section.
Width scaling in the contact geometry model
| Collar width | Contact area (model) | Mean pressure at 40 N | Model statement |
|---|---|---|---|
| 20 mm | ~46 cm² | ~0.87 N/cm² | Highest model value in range |
| 30 mm | ~69 cm² | ~0.58 N/cm² | Mid-range scaling |
| 40 mm | ~92 cm² | ~0.43 N/cm² | Lowest model value in range |
Why the model breaks in practice
p̄ is a model value. It describes how pressure would be distributed in the ideal case — not how it actually is. Four factors break the model structure, and none of them is rare.
The padding paradox is the sharpest example. Carter et al. (2020) found in pressure measurement tests that padded collars under certain conditions produced higher peak pressures than flat ones. The cause: a convex padding profile contacts only its ridge. Aeff drops, the measured peak rises. The model predicts the opposite.
The cylinder model assumes an ideally flexible band and full-surface contact. The table below maps where each model assumption breaks down in practice.
| Influencing factor | Effect on model value | Which model assumption breaks |
|---|---|---|
| Edge loading | Local pressure increase at band edges | Assumption: uniform distribution across b |
| Padding geometry (convex profile) | Reduced effective contact area | Assumption: band lies flat |
| Material stiffness | Band does not fully follow curvature | Assumption: full-surface contact |
| D-ring / buckle position | Local force concentration at leash attachment | Assumption: uniform force distribution across arc |
Every factor shifts real pressure above the model average.
Beyond the static mean are dynamic force spikes during leash jerks. The time profile of those forces is covered separately in the article on Static and dynamic leash forces on a dog collar.
Model result and practical context
In the model, a 40 mm collar at equal leash force produces a lower mean surface pressure than a 20 mm band.
This holds under the conditions S2 through S4 describe: static force, full-surface contact, circular neck cross-section. The model represents static conditions. How force spikes behave over time — whether and when leash force briefly jumps to a multiple of its resting value — is outside the model scope.
The model also applies only to the collar as a force-transfer system. Whether a chest harness behaves mechanically differently is not part of this model. Collar or harness: where force travels covers that load path separately.
The model describes a geometric relationship at a given collar position on the neck. Whether that position is reproducible in daily use — whether the collar actually sits where θ = 240° applies — depends on fit. How a dog collar should fit addresses that question directly.
System boundaries
The model quantifies mean surface pressure as a geometric average. It does not describe clinical effects and is not suited for injury prediction. The real neck cross-section is oval, not circular; the cylinder model simplifies that geometry.
| Topic out of scope | Further reading |
|---|---|
| Anatomical structures of the dog neck | Dog neck anatomy ↗ |
| Neck geometry in sighthounds and NHR logic | Sighthound collar: width and neck geometry ↗ |
| Material properties and recycled content | Dog collar: leather or nylon ↗ |