What is leash tension?
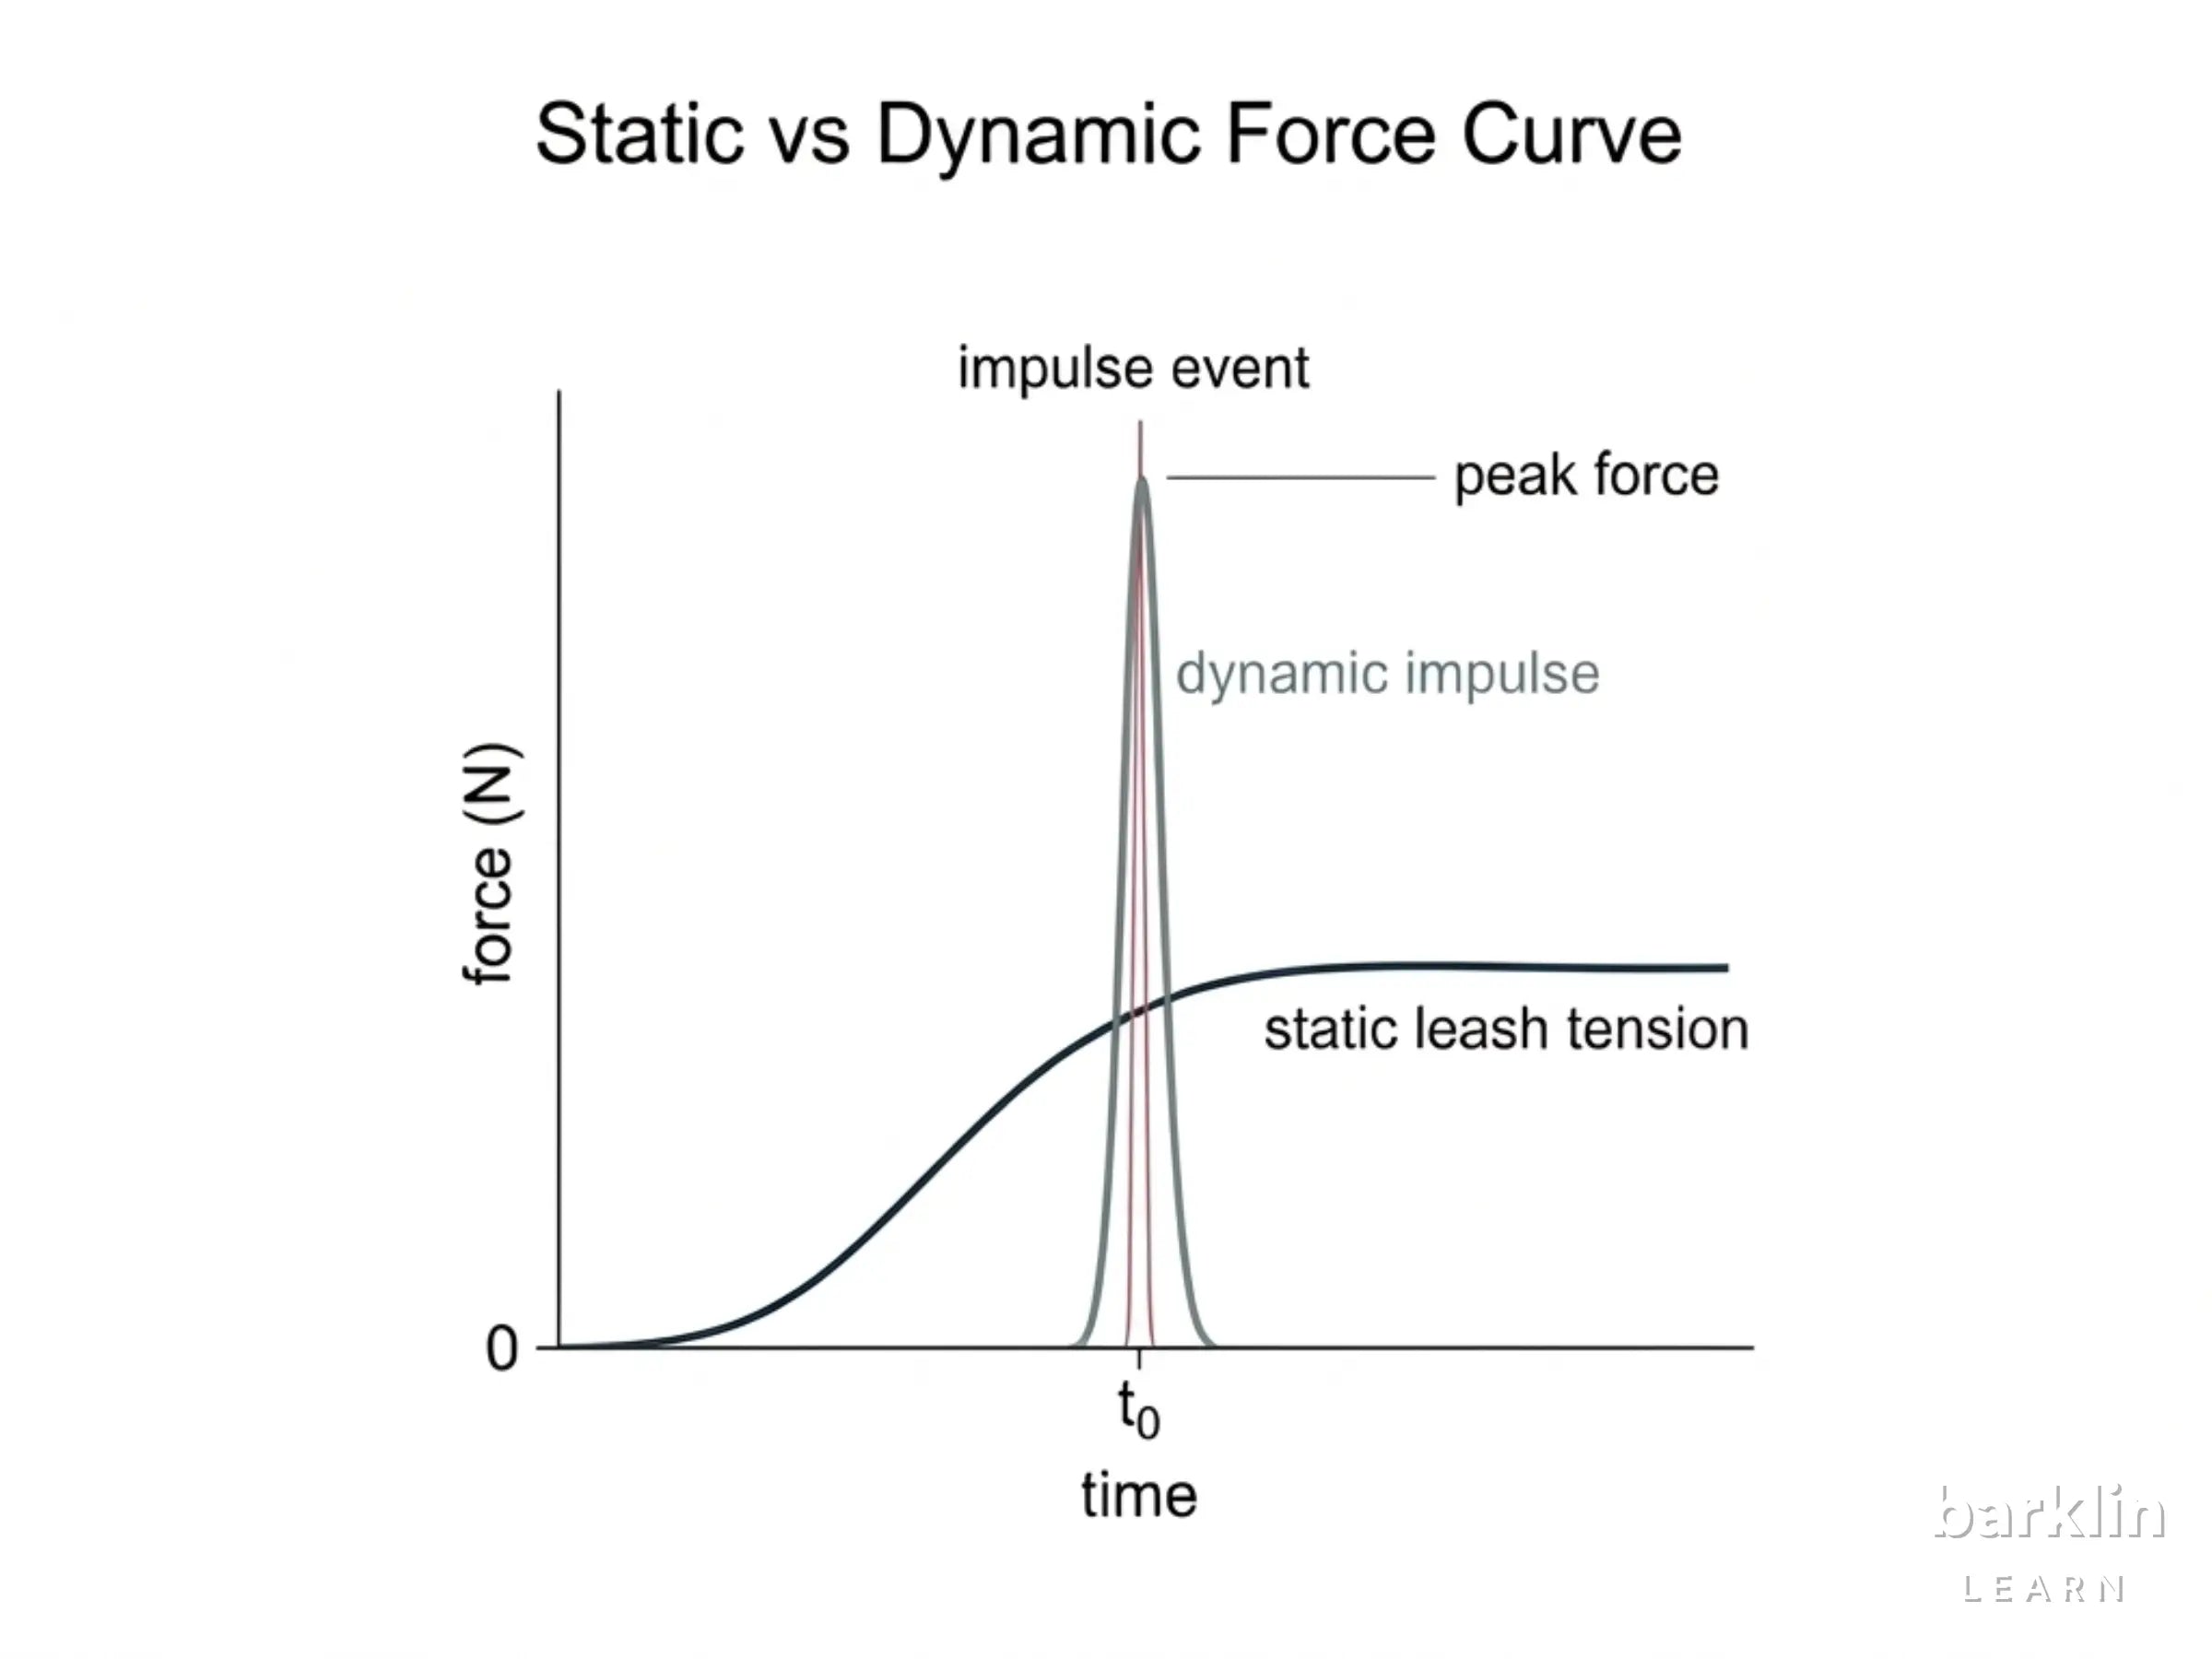
On an average walk, leash tension sits at 37.8 N (ScienceDirect 2024). A steady plateau — predictable, relatively constant, and sustained over time. This is what the model calls static load.
A different state occurs during an abrupt stop event. The dog is moving at speed v, the leash goes taut, and the movement is cut short. The impulse Δp = m · v has to be absorbed in a short time window. What follows is not a steady force, but a brief spike. The load path and contact area stay the same. The force level does not.
Both states occur during the same walk session. Which one dominates depends on how the dog moves. How the collar geometry responds to these force differences is where the concept of a wide dog collar becomes relevant as a contact area variable.
The impulse equation F · Δt = Δp describes the underlying mechanism. A shorter stopping time Δt at constant impulse Δp increases F proportionally. By how much is quantified by the Dynamic Load Factor in section three.
Measured force values on dog collars
Every leash force takes the same structural route: from the D-ring as the force entry point, through the collar strap into the contact arc, where the neck reaction force absorbs the load. This path is structurally invariant. Static and dynamic loads do not change it. What changes is exclusively the force magnitude.
Instrumented studies on companion dogs have measured this spectrum. The following overview shows how the three load types differ in measured force range, stopping time, and Dynamic Load Factor (DLF).
| Load type | Force range | Stopping time (Δt) | DLF |
|---|---|---|---|
| Static (steady pull) | 20–80 N (mean 37.8 N) | continuous (Δa ≈ 0) | 1× (reference) |
| Dynamic, light (controlled lunge) | 100–165 N (peak 162.8 N measured) | ~100–200 ms | ~3–5× |
| Dynamic, hard (sprint to leash end) | 200–413 N (max 412.5 N measured) | <100 ms (loading rate: 2,868.7 N/s) | up to ~10× |
| All force values from instrumented studies on companion dogs. DLF > 2 = shock load per engineering definition. Stopping time: estimated time windows from loading rate data (Townsend et al., 2026). | |||
A DLF of 3–5× means: the same collar system transmits three to five times more force during a lunge than during a steady pull — through the same load path.
Source context: ScienceDirect 2024 — instrumented walk, companion dogs; Townsend et al., 2026, Annals of Biomedical Engineering.
The DLF ceiling of ~10× marks the upper model boundary, extrapolated from the loading rate of 2,868.7 N/s (Townsend et al. 2026). How this limit is reached is explained in section three. How the load path behaves when it runs through a harness rather than a collar is covered in load path comparison: collar vs. harness.
Dynamic Load Factor (DLF)
The Dynamic Load Factor quantifies the ratio between peak force and static baseline: DLF = Fpeak / Fstatic. Its physical basis is the impulse equation F · Δt = Δp, rearranged to F = Δp / Δt.
When stopping time Δt decreases, peak force F rises proportionally — with the same impulse Δp. That is the structural rule this model is built on.
What matters is not only the force itself, but the time over which it builds. Diagram 2 shows the simplified impulse model: a long stop produces a wide, moderate force curve. A short stop produces a narrow, very high spike.

When stopping time decreases, peak force rises. With a constant impulse Δp = m · v, that is not a variable — it is physics.
An example with measured values: static baseline 37.8 N (ScienceDirect 2024). During a controlled lunge, force rises to 162.8 N (peak measured, ScienceDirect 2024), corresponding to a DLF of ~4.3×. During a sprint to the leash end, up to 412.5 N were measured (Townsend et al. 2026), a DLF of ~10× under extreme conditions.
This is not a failure of the equipment.
Three factors drive high DLF values: (1) a high movement speed of the dog before the stop, (2) a tautly held leash with little slack, (3) a very short braking distance that drives Δt toward zero. In rope mechanics, the fall factor describes analogously how free fall generates system load. Applied to the leash system: not the force alone, but the ratio of impulse to stopping time determines the peak load.
Above DLF > 2, the event qualifies as shock load by engineering definition. Light lunge events in everyday walks — when the dog pulls toward something or changes direction — regularly fall within this range.
The load path itself does not change. Diagram 3 makes this visible: force enters at the D-ring and is transmitted through the collar strap into the contact arc.

Static and dynamic loads share the same geometric path. Only F varies, not the path.
Load types compared
The two load types look nothing alike over time. Static pull produces a slow force rise to a stable plateau, maintained over seconds or minutes. Dynamic impulse produces a steep rise, a very brief spike, and rapid release — over the same load path.
Carter et al. (2020, Veterinary Record) measured pressure values of 83–832 kPa in an instrumented collar model, depending on collar type and force level. This range serves as a contextual reference: it shows that the pressure level responds to both variables — force F and contact area A. The following table shows how collar width changes the contact area and thereby affects the pressure level at different load levels.
| Collar width | Contact area (A, approx.) | Pressure level — static | Pressure level — dynamic (DLF 3–5×) |
|---|---|---|---|
| Narrow (≤ 2 cm) | low | high | very high |
| Medium (3 cm) | medium | medium | high |
| Wide (≥ 4 cm) | large | low | medium |
A wider contact area distributes the same force across more surface. This holds at static baseline and is even more pronounced at dynamic peak values.
The levels (low / medium / high / very high) are ordinal. Absolute kPa values depend on neck circumference, neck shape, and force level, and cannot be generalized across all dogs. As sighthound neck anatomy and wide collars shows, the geometric contact zone also varies substantially between breeds and individuals.
Collar geometry and load peaks
This is where the geometry becomes relevant. When dynamic peak loads can exceed the static value by a factor of 3–10×, the contact area of the collar becomes a structurally significant variable.
The relationship is P = F / A. P is the mean contact pressure, F is the leash force, A is the contact area — determined by collar width and contact arc. When A increases, P decreases at the same force. With double the collar width, the contact area increases accordingly. Mean contact pressure falls, even though the force stays the same.
With identical leash tension, the contact area determines how concentrated the local load becomes. Diagram 4 shows this relationship for a 2 cm and a 4 cm collar under identical leash force.

The increase in contact area reduces mean contact pressure according to P = F / A, at static load and more markedly at dynamic peak values, as the same contact area then carries a force that is several times higher.
This applies to both load types: a wider collar distributes 37.8 N of static tension across more surface, and the same geometry distributes a 162.8 N lunge across more surface — transferring it less locally to the ventral neck region.
The relationship P = F / A holds in the linear range of moderate to medium leash events (< 200 N). At extreme sprint-arrest events (> 300 N), the edge-loading effect — a load concentration on the boundary zones of the contact arc — can modify this linear picture. This case is addressed in section six.
How pressure distribution behaves geometrically and which collar width corresponds to which situation is shown in the further reading article pressure distribution in wide dog collars.
System boundaries
This model assumes planar neck geometry, a defined contact arc, and the linear validity range of P = F / A. Factors outside these assumptions are listed below as unmodelled variables, external topics, or model boundary cases.
| Out of scope | Status / Further reading |
|---|---|
| Body posture and neck movement during the pull event | Not within scope of this geometry model |
| Coat, undercoat, and individual skin thickness | Not modelled |
| Individual anatomical variation such as neck shape or muscle mass | Sighthound neck anatomy |
| Hardware fatigue under repeated dynamic load | Not modelled |
| Multiple lunge events in sequence and accumulated load | Not modelled |
| Load paths at the harness | Load path: collar vs. harness |
| Edge-loading from ~300 N | Boundary case of this model |
| Breed- and size-specific anatomy data | Sighthound neck anatomy |
| Pressure distribution in absolute kPa or Newton values per breed | Pressure model |
| Product recommendations by collar width | Product overview |